
All-to-Know: How Do Mortgage Rates Impact Affordability?
Mortgage rates are changing all the time. However, are you ever curious about how mortgage rates are set and how mortgage rates impact mortgage affordability? This article has you covered. Let's go on reading. Moreover, you can personalize your rates on MyMortgageRates and get a professional loan officer to help you out.
What Are Mortgage Rates?
First of all, let's learn about mortgage rates. They are the annual cost of borrowing to buy a home, expressed as a percent. They determine your monthly principal & interest payment and, together with term and price, drive total interest paid over the life of the loan. Even relatively small changes in mortgage rates materially change monthly payments and therefore purchasing power, which is why loan officers and retailers must routinely factor current rates into affordability calculations.
Large data studies show the mechanical effect clearly: higher rates raise monthly payments and reduce the share of households that can afford a given median-priced home. For example, CFPB analysis shows that from the pandemic trough to the 2023 peak, rate increases added roughly $1,265 to the P&I payment on a $400,000 loan. That's a large percentage increase in monthly P&I.
How Are Mortgage Rates Set?
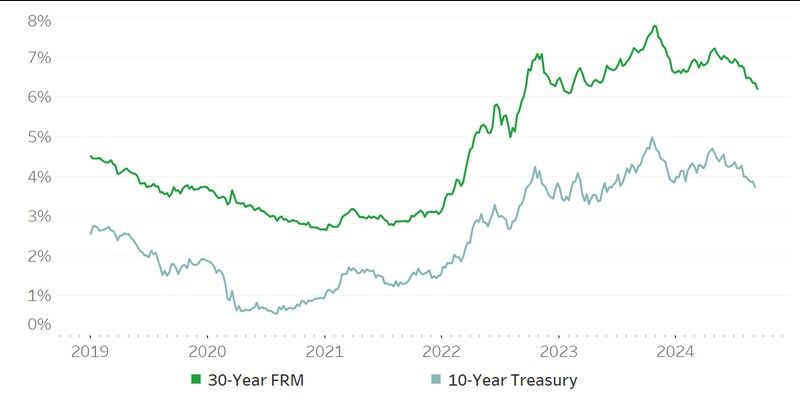
Mortgage rates are set by many factors: the 10-year Treasury yield (a benchmark for mortgage investors), spreads on mortgage-backed securities, lender margins, borrower risk (credit score, LTV), and broad macroeconomic drivers such as inflation, employment, and Fed policy. Changes in Fed policy influence short-term rates and market expectations, which in turn affect mortgage yields, but mortgages do not move one-for-one with the federal funds rate because of investor demand and MBS market dynamics. The CFPB and regional Fed research both document the channels.
How Rising Mortgage Rates Impact Affordability
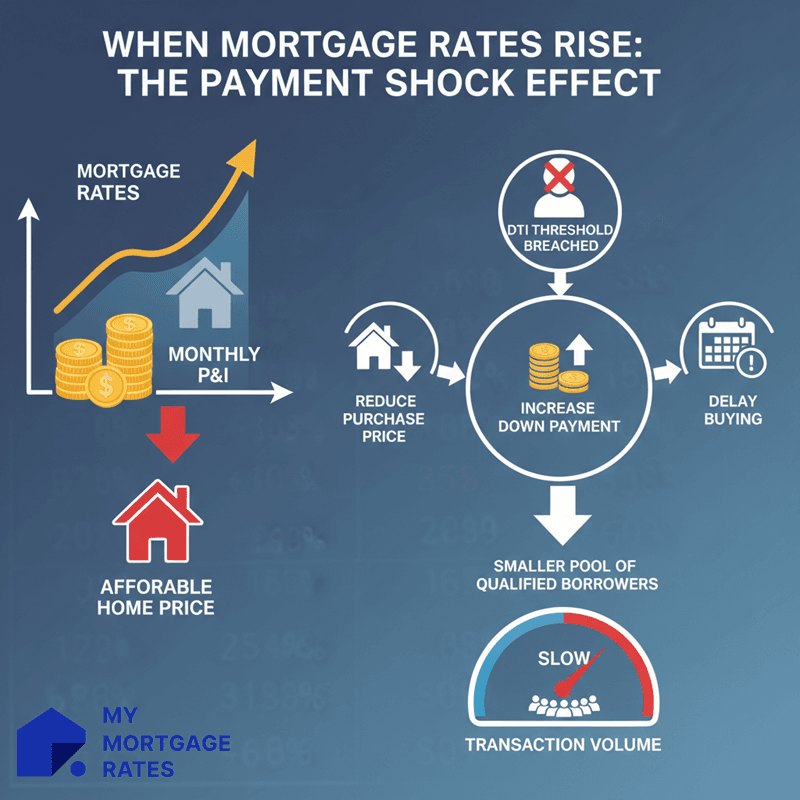
When mortgage rates rise:
-
Monthly P&I increases for the same loan size, reducing the price a borrower can afford for a fixed monthly budget.
-
Many borrowers are pushed beyond underwriting DTI thresholds and must reduce purchase price, increase down payment, or delay buying.
-
The "payment shock" effect reduces the pool of purchase-qualified borrowers and tends to slow transaction volume.
A useful rule-of-thumb, which is widely used by mortgage and real-estate sites, is that a 1 percentage-point increase in a 30-year rate reduces purchasing power by roughly ≈10%. The exact percent depends on the starting rate and taxes/escrows. For instance, keeping the same monthly payment, a $400,000 loan at 5% would support about $358,000 at 6%, roughly a 10% drop in buying power. Use this as a quick estimate, not a precise substitute for lender calculators.
Meanwhile, prices matter. The Dallas Fed and other research stress that mortgage rates are only one driver, house prices respond to rates and other factors, so the net effect on affordability depends on how prices move as rates change. In some scenarios, lower rates can push prices up and offset affordability gains. That's why decompositions of affordability separate the rate channel from the price channel.
Examples of Rising Mortgage Rates Impact Affordability
Here's a specific example for you to reference. A borrower taking a $300,000 loan (30-year fixed):
-
At 4.00% P&I ≈ $1,432/month.
-
At 7.00% P&I ≈ $1,996/month.
That $564/month increase can push borrowers over DTI caps and make many previously-affordable properties unaffordable under standard underwriting.
Real-world studies and lender pipelines show fewer qualified purchase applicants and longer sales cycles when rates rise sharply. CFPB and Fed research document how higher rates plus higher prices have made affordability substantially worse since 2021.
How Falling Mortgage Rates Impact Affordability
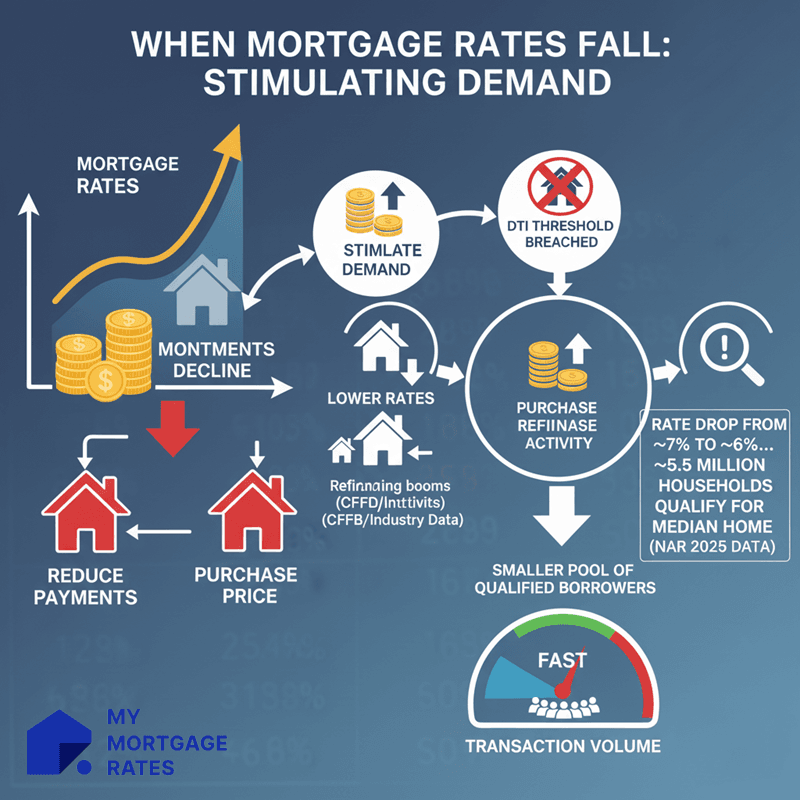
When rates fall, monthly payments decline for the same principal. Borrowers can either reduce payments or afford a higher purchase price for the same payment. Lower rates typically stimulate purchase demand and refinancing activity. CFPB and industry data both show refinancing booms when rates fall, though not all eligible loans refinance. Refinance take-up is uneven across demographic groups.
NAR and related industry modeling find that a move from high 7%-range rates down to ~6% could allow several million additional households to qualify for median-priced homes. NAR's public statements in 2025 cited around 5.5 million more households able to afford a home if rates fell to 6%, using their methodology. That scale illustrates how rate changes change the size of the eligible buyer pool.
Examples of Falling Mortgage Rates Impact Affordability
Here is a real historical example. When rates dropped from the high single digits down into the low-3% range in the early 2020s, monthly payments on typical loan sizes fell dramatically, and millions refinanced, producing a large refinance boom and widening buying power for purchasers who entered the market while rates were low. CFPB documents the scale of P&I swings between the pandemic trough and the 2023 peak, which generated very large payment differentials across cohorts.
How Do Rising Interest Rates Affect the Housing Market?
Higher rates generally cool buyer demand, reducing bids, slowing transactions, and can lead to slower price appreciation or local price corrections, but the magnitude depends on local supply/demand dynamics. A key secondary effect is "rate lock-in": many existing homeowners sit on much lower mortgages and are reluctant to sell into a higher-rate environment, which can tighten for-sale supply while demand softens. The Dallas Fed emphasizes that the net effect on affordability depends on how house prices respond to rate moves.
Builders and the construction pipeline also react: elevated rates and higher financing/costs for builders can temper single-family starts and new-home production. Forecasts for starts differ across forecasters and are sensitive to assumptions about rates, materials costs, and policy. Avoid citing a single point forecast without naming the source and timing. Projections for starts vary month to month.
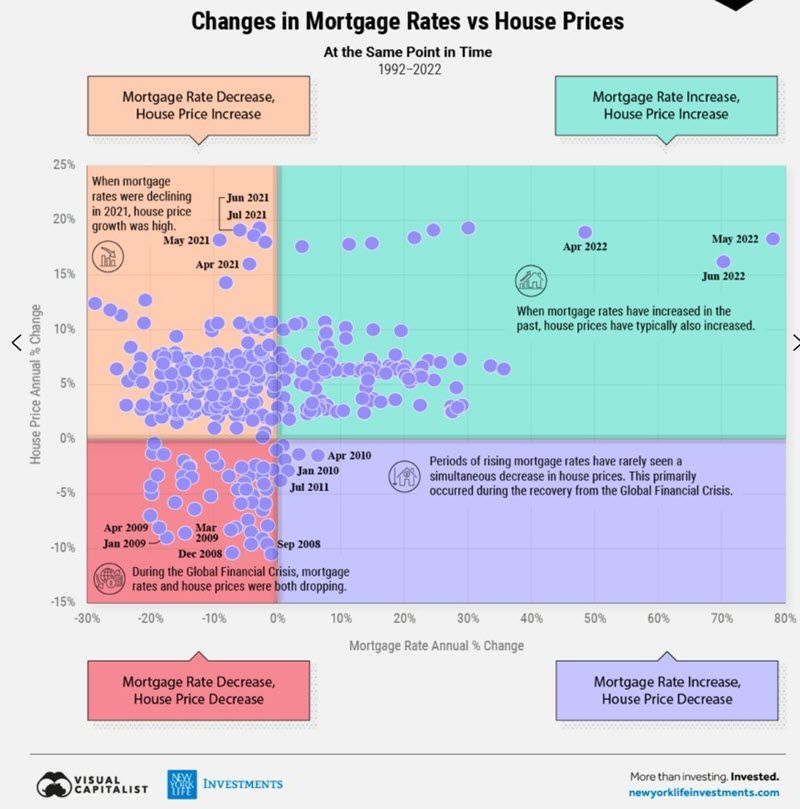
#Mortgage Interest Rates vs Home Prices Chart
Here's the chart for you to learn changes in mortgage rates vs house prices during 1992 to 2022 by Advisor.
How to Measure Affordability?
You may wonder how much house can you afford. Actually, mortgage affordability is commonly measured by:
-
Front-end (housing) ratio: housing costs (PITI) ÷ gross income, many advisers use ~28–31% as a conservative standard.
-
Back-end (total DTI): all recurring debt payments ÷ gross income, many underwriting programs look for DTI in the ~36%–43% range depending on program and overlays. CFPB and agency guidance show 43% as a common regulatory/underwriting benchmark for many qualified mortgages, though lenders may allow exceptions with compensating factors.
A common affordability rule for the broad market is that if housing costs exceed ~30% of the median household income, homeownership at that price point is considered unaffordable at scale. Researchers and policy bodies use this benchmark to flag market-level unaffordability. Please note that different institutions use slightly different thresholds, and be explicit which one you apply in content aimed at consumers.
Quantifying the Drivers of Affordability
The three primary components that drive affordability math are: income, home price, and interest rate. Research by Dallas Fed shows that both price growth and rate changes matter, and their relative importance varies over time, e.g., post-pandemic price gains were a dominant driver of deteriorating affordability even before rate moves. As a rule of thumb, a 1 percentage-point rate change typically has a similar directional effect on buying power as a roughly 8–12% change in price, which depends on the starting rate and taxes, so always model the specific case.
Tips to Improve Your Affordability
As for hesitant homebuyers, here are some practical levers for you to increase your mortgage affordability.
-
Increase down payment to lower loan size and avoid PMI.
-
Improve credit score to qualify for better rates.
-
Reduce monthly debts to improve DTI.
-
Use alternative loan programs like FHA, VA, USDA if eligible.
-
Consider longer amortization, for example, a 30-yr vs 15-yr, for lower monthly cost. However, the tradeoff is more total interest.
-
Time purchases or refinance to lower rate windows where possible, but don't assume any specific forecast, treat rate moves as uncertain, and run conservative stress tests.
FAQs About Mortgage Rates Impact Affordability
Q1. What will 30-year mortgage rates be in 2025?
No definitive answer, Mortgage Rate Predictions in 2025 vary by model and forecaster. Early-to-mid-2025 consensus among many forecasters was that rates would remain elevated relative to pandemic lows, with modest easing possible if inflation and Fed policy expectations shift, but uncertainty is large. Use current market quotes and lender guidance for operational decisions rather than relying on long-range point forecasts.
Q2. Will we ever see a 3% mortgage rate again?
Achieving ~3% 30-yr rates would normally require materially lower inflation expectations and/or a substantially easier Fed policy than currently priced by markets. While not impossible, most forecasters in 2024–2025 considered a return to 3% unlikely in the near term, absent a big macro shock. Treat very low-rate scenarios as low-probability planning cases unless you have strong contrary market signals.
Q3. How much does a 1% interest-rate change affect a mortgage?
A 1% change has a big impact on monthly payments and buying power. As a practical numerical example: keeping term constant, a $300,000 loan's P&I on a 30-year fixed changes from about $1,432 at 4% to $1,996 at 7%, a $564/month swing. Similarly, keeping the monthly payment fixed, a 1% rise in rate often reduces supported loan size by roughly ~10% depending on starting rate and assumptions.
Conclusion
Mortgage rates are a primary, but not the only, driver of housing affordability. For borrowers and industry professionals, the right approach is:
(1) Model the borrower's case using current rates and taxes
(2) Run stress-tests (e.g., +1%/−1% rate scenarios)
(3) Consider how local prices and inventory behave in your markets
(4) Be explicit about assumptions when you publish household-level afford-counts or "how many households can afford X" numbers. CFPB and regional Fed research are good background resources for these sensitivity exercises.
If you're a borrower, you may directly contact your local loan officers for more professional tips.