
30-Year Mortgage Rates Chart: Historical and Current Trends
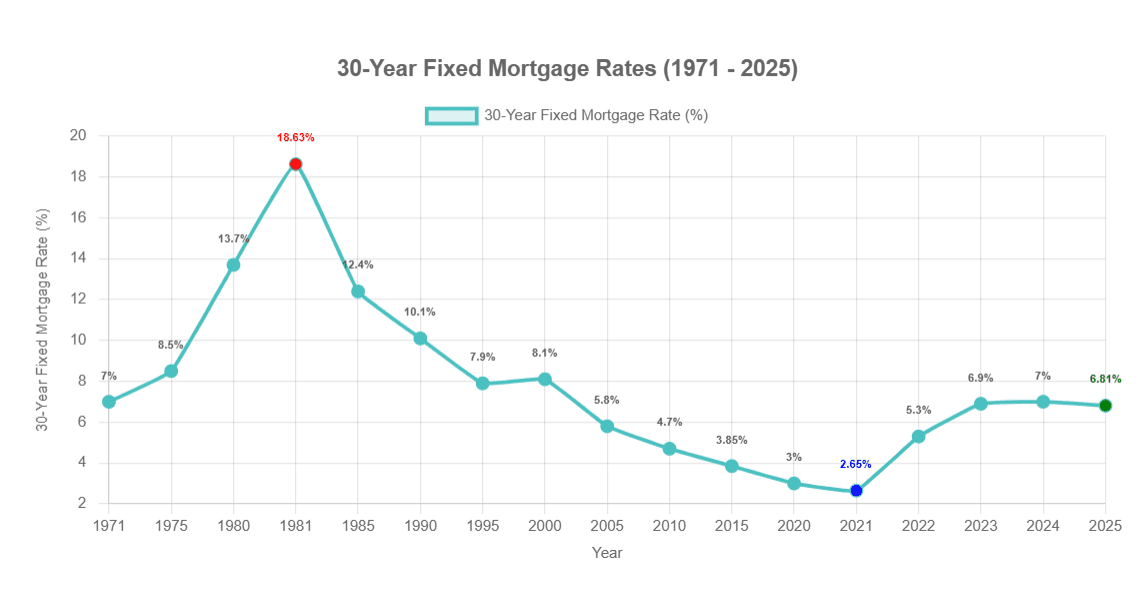 This chart displays the historical trends of 30-year fixed mortgage rates in the U.S. from 1971 through mid-2025, highlighting key periods of rate fluctuations. Data sourced from Freddie Mac.
When looking at the current 30-year fixed mortgage rate in mid-May 2025, the average stands at 6.81%. This 30-year mortgage rates chart helps visualize how today's rates compare to those in past decades and offers crucial context for borrowers considering home purchases or refinancing.
People Also Read
- 30 Year Mortgage Principal and Interest Chart Explained: The Shocking Truth You Won’t See on
- 40-Year Mortgage Rates in 2025: Is a Fixed 40-Year Loan Worth It?
- How to Get a 40-Year Mortgage: Step-by-Step Guide, Pros, and Hidden Risks
- 40 Year Mortgage Programs in 2025: Rates, FHA Options, and Top Lenders Explained
- Looking for a Second Mortgage? Your Complete Guide to Eligibility, Rates & Smart Borrowing
Current 30-Year Fixed Mortgage Rate: The Mid-May 2025 Snapshot
Let’s cut to the chase—you’re probably here because you’re sweating over a potential home purchase or wondering if it’s finally time to refinance. As of mid-May 2025, the average 30-year fixed mortgage rate is sitting at 6.81%, according to Freddie Mac’s trusted survey. Before you celebrate or panic, let’s put that number in perspective.
Compared to last year’s mid-May rate (which hovered stubbornly in the low 7% range), today’s numbers are slightly more forgiving. But here’s the kicker: just a few weeks ago, rates dipped flirtatiously into the mid-6% territory before climbing back up. It’s like watching your favorite stock—you blink, and the numbers dance away from you.
Visualize this: a tiny rollercoaster on a line graph. Late April 2025 shows a gentle slide downward, early May teases hopeful buyers with lower digits, and now—poof—we’re back to 6.81%. Annoying? Maybe. Unusual? Not at all. This is the mortgage rate tango, and it’s been doing this for decades.
30-Year Mortgage Rates Chart (1971–Present): A Journey Through Time
Now, let’s zoom out. Way out. If we could strap a GoPro to the 30-year mortgage rates from 1971 to today, the footage would be a wild ride—part thriller, part horror movie, with a few boring stretches where you’d check your phone.
The "Holy Cow!" Moment (1981): Picture your parents or grandparents clutching their pearls in October 1981 when rates peaked at 18.63%. That’s not a typo. An $800/month house payment today would’ve been a soul-crushing $2,400 back then. Suddenly, your 6.81% doesn’t seem so tragic, right?
The "Wait, That Can’t Be Right" Dip (2021): Cut to January 2021. Pandemic life had one silver lining: rates hit a jaw-dropping 2.65%. People were refinancing like they’d found a cheat code. If you missed that boat, I feel you—I, too, was busy baking sourdough.
The Big Picture:
- 1980s: Rates camped in double-digit hell.
- 1990s: A slow descent to 7–9%.
- 2000s: Mostly 5–7%, with a side of housing bubble drama.
- 2010s–2021: The "golden age" of 3.5–5%, ending with those absurd 2.65% lows.
- 2022–2024: Rates woke up grumpy, clawing back to 7% as the Fed fought inflation.
Today’s 6.81%? Historically, it’s actually below average (the 50-year mean is around 7.5–8%). Context is everything.
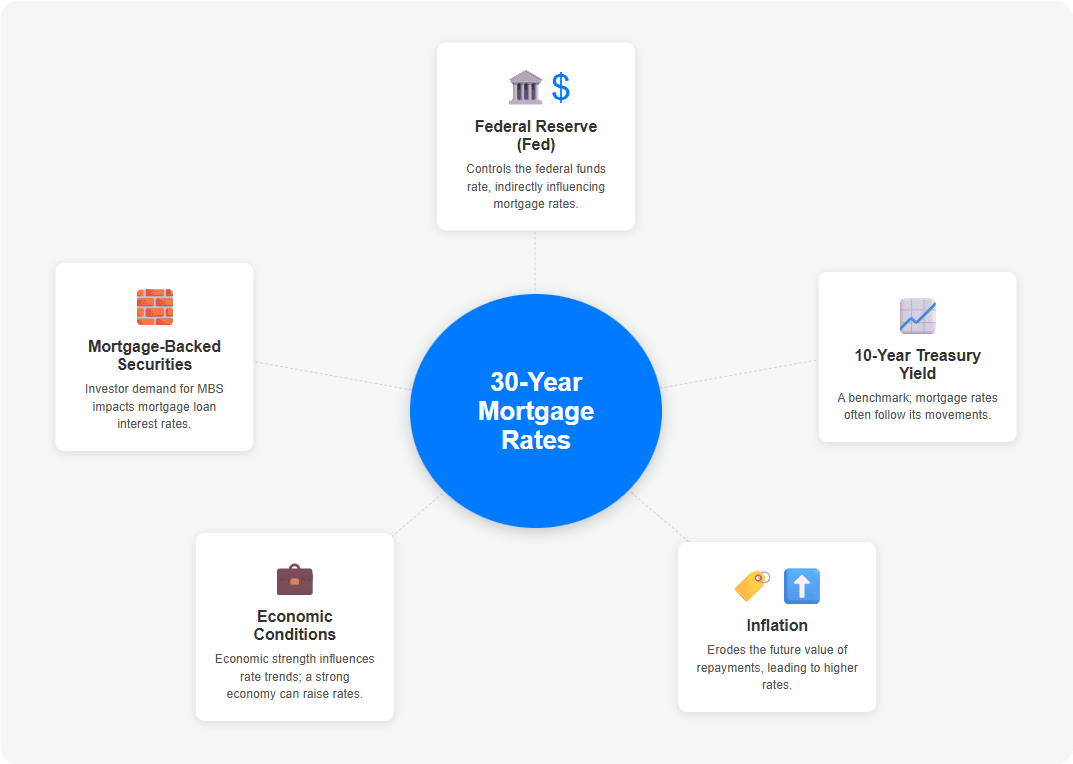
What Drives Mortgage Rates? The Machinery Behind the Numbers
Here’s where most articles glaze your eyes over with jargon. Not today. Let’s break it down like you’re explaining it to a caffeine-deprived friend:
The Federal Reserve ("The Puppet Master"): The Fed doesn’t directly set mortgage rates, but its moves ripple through the economy. When it raises the federal funds rate (what banks charge each other for overnight loans), mortgage lenders go, "Hmm, money’s getting pricey—let’s charge more." Simple as that.
10-Year Treasury Yields ("The Mortgage Rate Shadow"): Think of this like a conjoined twin. Mortgage rates live in the shadow of the 10-Year Treasury yield. If investors ditch Treasury bonds (say, because the stock market’s hot), bond yields rise—and boom, mortgage rates follow.
Inflation ("The Silent Thief"): Lenders hate inflation because it erodes the value of their future repayments. If a dollar today buys less than a dollar in 2055, they’ll demand higher rates to compensate. It’s like charging extra for a pizza you’ll deliver next year—you know cheese will cost more by then.
The Economy’s Mood Swings: Good jobs report? Rates might inch up. Recession fears? Rates dip. It’s a constant tug-of-war between optimism and panic.
Mortgage-Backed Securities (Wall Street’s Playground): When investors gobble up these bundled loans, lenders can offer lower rates. When they lose appetite? Rates climb. It’s supply and demand with a side of Wall Street whimsy.
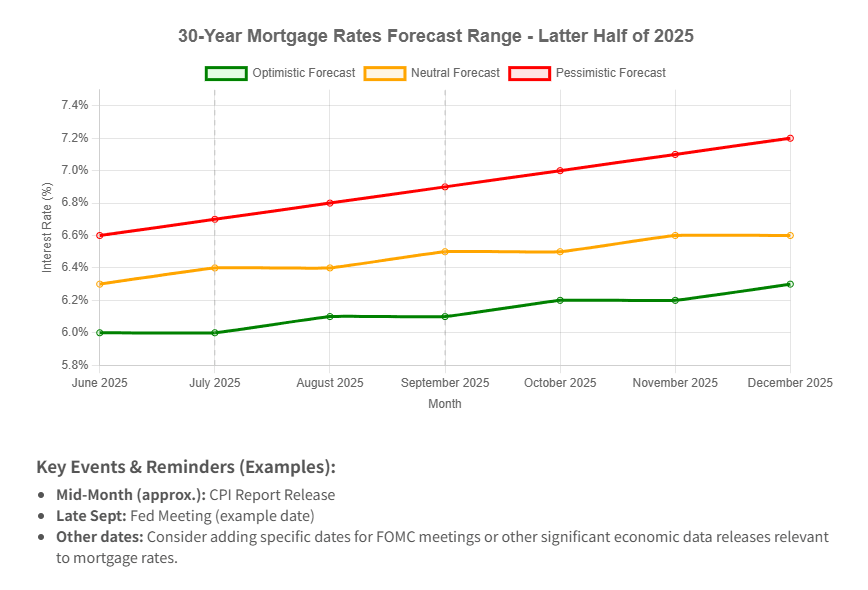
Rate Forecast: Where Are Rates Headed in Late 2025 and Beyond?
Cue the crystal ball jokes. Nobody knows, but here’s what the pros are whispering (with crossed fingers):
The Optimists (NAR, MBA, etc.): "If inflation keeps cooling, we might see rates slide toward 6.0–6.3% by late 2025." Key word: might.
The Realists (Grimacing Analysts): "Remember 2023? Everyone predicted drops, and then—surprise!—war/tech bust/inflation boomerang. Proceed with caution."
What to Watch:
- CPI reports (inflation’s report card)
- Fed meeting minutes (read between the "patient" and "vigilant" buzzwords)
- Jobs data (strong numbers = rate hike risks)
My Take? If you’re waiting for 2% rates to return, you’ll be waiting longer than GTA 6’s release date. For expert analysis of future scenarios, see our 2025 mortgage rate predictions breakdown.
Should You Buy or Refinance Now? Making Sense of It All
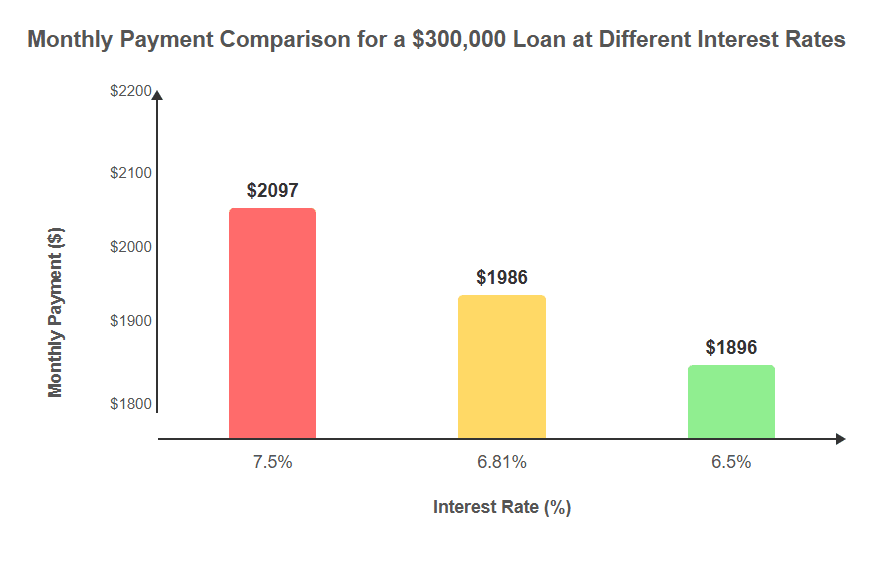
Let’s get practical. At 6.81%, here’s the math on a $300,000 loan:
- At 7.5%: $2,097/month
- At 6.81%: $1,986/month
- At 6.5%: $1,896/month
That’s $200+/month difference—aka a car payment or a very fancy grocery haul.
For Buyers: "Marry the house, date the rate" isn’t just a cute slogan. My cousin waited for rates to drop in 2023… and watched home prices leap another 10%. Ouch.
For Refinancers: If you’re sitting on a 7.5%+ loan from 2022–2024, even a 0.5% drop could be worth it—if you plan to stay put. Run the break-even math (closing costs ÷ monthly savings).
Pro Tips:
- Boost credit scores (even 20 points can shave off 0.25%)
- Shop lenders (I saved 0.375% last year by pitting three banks against each other)
- Consider buying points (if you’ll stay 5+ years)
Conclusion: Knowledge is Power (But Timing is Luck)
Here’s the raw truth: obsessing over daily rate swings will drive you nuts. Focus on what you can control—your credit, your budget, and finding a home you’ll love even if rates zigzag.
Want the latest numbers? Check Freddie Mac’s weekly survey—or better yet, contact one of our loan officers. They’ve got the tools, insights, and a free rate tracker template that’s helped our clients save thousands. Now go forth and conquer (or at least, refinance wisely).